
If you’re a Head Start organization, you know several reports and check-ins are required throughout the year. One mandatory item is to complete an annual performance indicators report (PIR), which includes a comprehensive list of data related to programs and services. After gathering all the necessary information, how many Head Start programs take this organized data and use it to make informed decisions about their program?
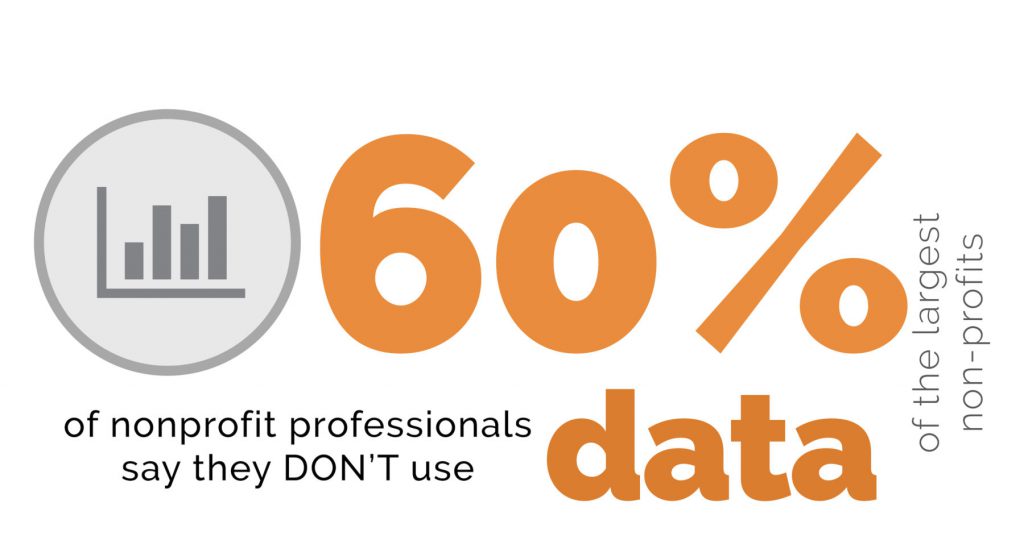
At Transform Consulting Group (TCG), we don’t know the answer to this question. However, data needs to be utilized in several industries. Research shows that 60% of nonprofit professionals need to use data! As data nerds, this is a problem. We work to challenge this statistic with all the organizations we support, including Head Start programs, to help them understand how to use data to drive program impact.
First, let’s talk about driving impact. Forces for Good: The Six Practices of High-Impact Nonprofits teaches that becoming a high-impact nonprofit is more than building a stand-alone organization that delivers excellent service. With the abundance of Head Start program data in the PIR, programs can tell a story beyond services and participants. The data can tell a story of the organization’s outputs, accomplishments, and areas for opportunity. (Read more about how to use data to tell your story in this blog). We want you to do more than meet basic requirements and have included 3 recommendations for Head Start programs to use PIR data to drive program impact.
Using Performance Indicators Report Data To Drive Impact
- Refer to the original data sources used to organize the PIR data to determine what, if any, of the program data can be linked (via student, program, teacher, etc.). Linking data across various disciplines allows programs to see how the areas may or may not impact each other. For example, programs can link attendance data with child outcome data to determine if chronically absent students perform worse on child outcomes than those who miss little to no program days. If you can’t link your information, check out this blog for managing program data.
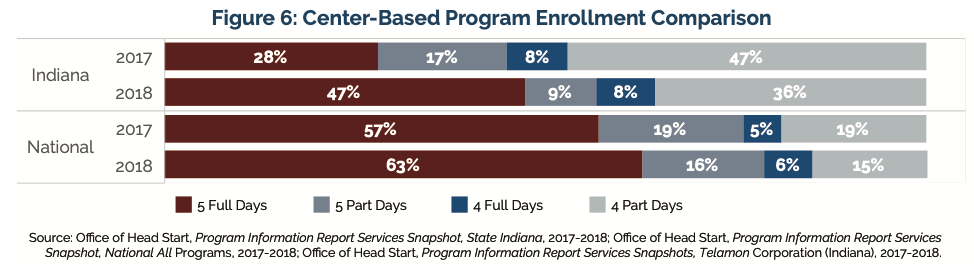
- Compare your grantee’s PIR information to the national summary, state summaries, and/or other local grantee summaries. PIR summaries have become public-facing at the Head Start Early Childhood Learning and Knowledge Center. We drafted a case study example on the National Head Start Association Data Playbook that compares Indiana’s Head Start program schedule to the National Head Start one. This revealed Indiana is behind in getting its programs to full-day, full-week operations compared to the rest of the country. We also compared National data to Indiana Head Start in the 2019 Indiana Head Start Needs Assessment.
- Develop high-level infographics to tell your organization’s data story. These infographics can be used in board reports, funding applications, and marketing materials. Infographics can demonstrate community needs, show how your organization meets needs, and call people to action. Check out our blog about how infographics can maximize impact to learn more and generate ideas for your own infographics
We don’t want to see your organization’s data sitting away in a file. Get it out to demonstrate your program’s impact and drive improvement. This blog highlights several resources to guide your work, but if you’re still feeling overwhelmed, we are happy to help. Contact us today for a free consultation.